Most ballistics tools give you a range card: a table of numbers at fixed distances. It tells you what your bullet is doing at 100 yards, 200 yards, 300 yards. That's useful, but it's a snapshot, not a picture. You're reading individual data points with nothing in between.
The BSL graph shows you the continuous curve, every yard of it, so you can see how your bullet behaves across the full flight, not just at the lines someone drew. Before you can use that, you need to know what the graph is actually showing.
What the Axes Mean
The horizontal axis is range in yards. Left to right, it runs from your muzzle out to whatever maximum distance you've set.
The vertical axis is bullet position in inches, measured relative to your line of sight, not the ground. The zero line running across the middle of the graph is your crosshairs. Values above that line mean the bullet is above your aim point. Values below it mean the bullet is below.
This is a detail that trips up new users: the graph is not showing you how high off the ground your bullet is. It's showing you where your bullet is compared to where you're aiming. That distinction matters, because it's what connects the graph directly to a hold.
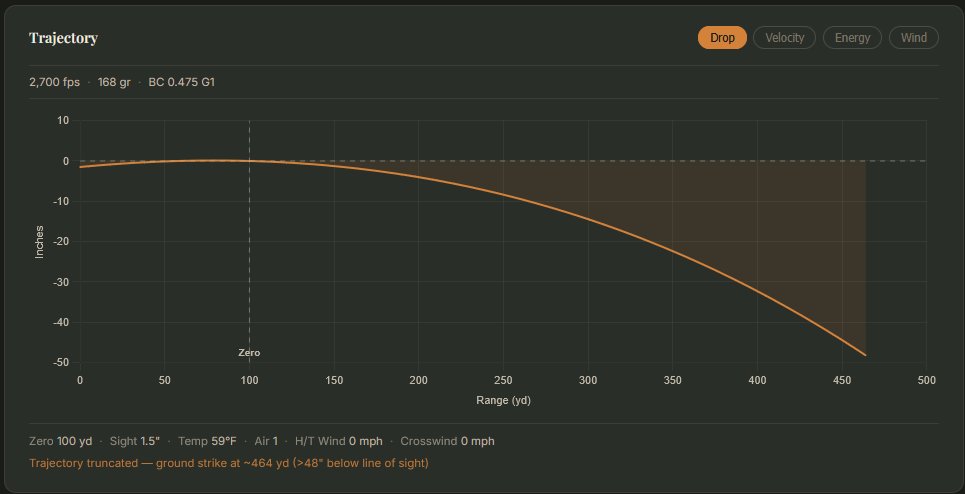
The horizontal axis is range. The vertical axis is bullet position relative to your line of sight. The zero line in the middle is your crosshairs.
Where the Zero Shows Up
The curve will cross the zero line at your zero distance. That crossing point is the distance at which your bullet intersects your line of sight, which is exactly what zeroing your rifle achieves.
Hover along the curve and a bubble appears showing the exact range and drop value at that point. At 100 yards the bubble reads zero: that is the zero crossing, the point where the bullet intersects your line of sight.
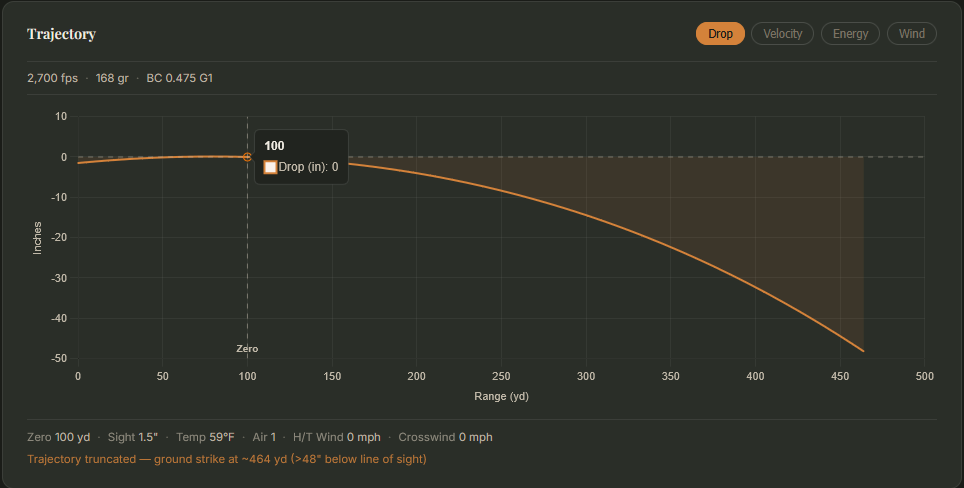
The bubble at 100 yards reads zero. That is the zero crossing: the bullet is exactly on your line of sight at this distance.
Reading Holdover From the Graph
Every negative value the bubble shows past your zero is a holdover number.
At 200 yards the bubble reads -4.01 inches. That means if you aim dead-on at a target 200 yards away, your bullet will strike 4 inches low. To put the bullet on target, you hold 4 inches high. At 300 yards the bubble reads -14.42 inches, so you hold just over 14 inches high.
Those numbers become intuitive when you attach them to something physical. Just over 14 inches is roughly the depth of a whitetail deer's vital zone. At 300 yards, with this load and this zero, you're already holding almost a full vital zone above your point of aim. That is a meaningful number in the field, and the graph gives it to you before you ever take the shot.
But the real value is what happens between the round numbers. A range card gives you 200 and 300. The BSL graph gives you every yard in between.
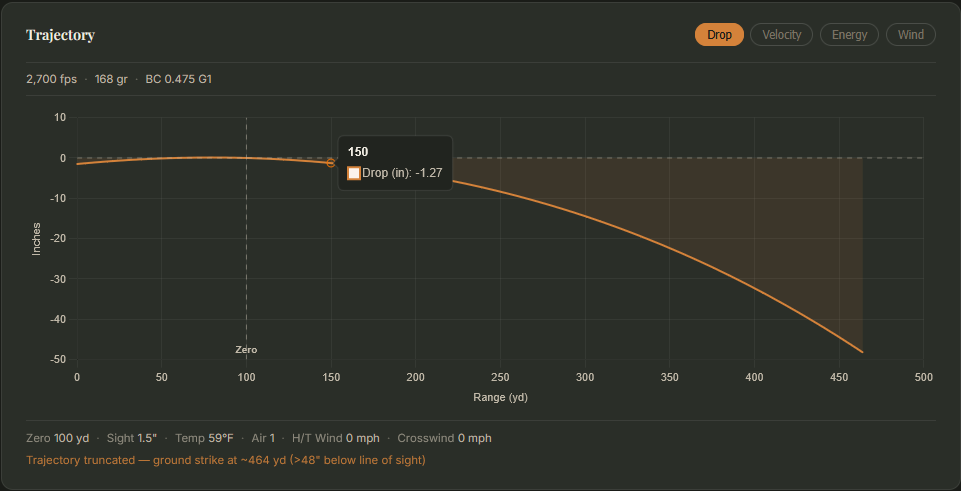
150 yards: -1.27 inches. Easy to hold, easy to forget about at this range.
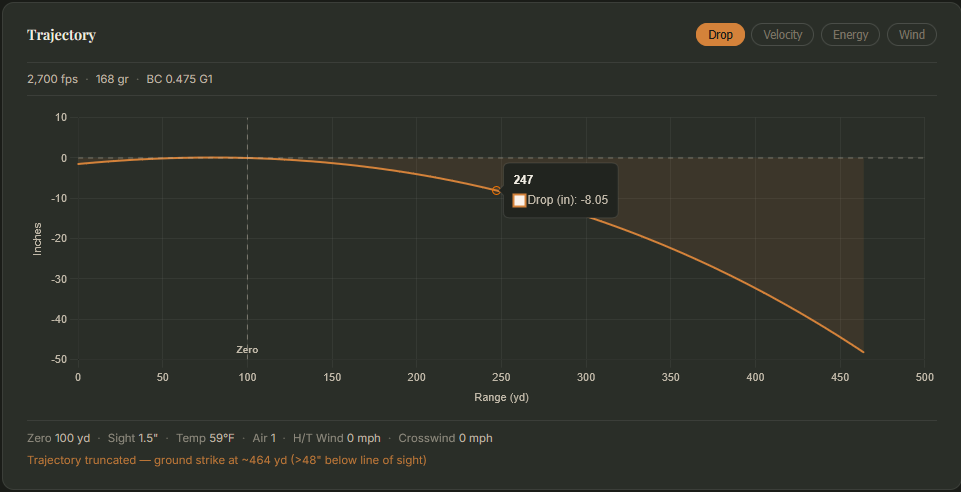
247 yards: -8.05 inches. Not a number any range card would show you.
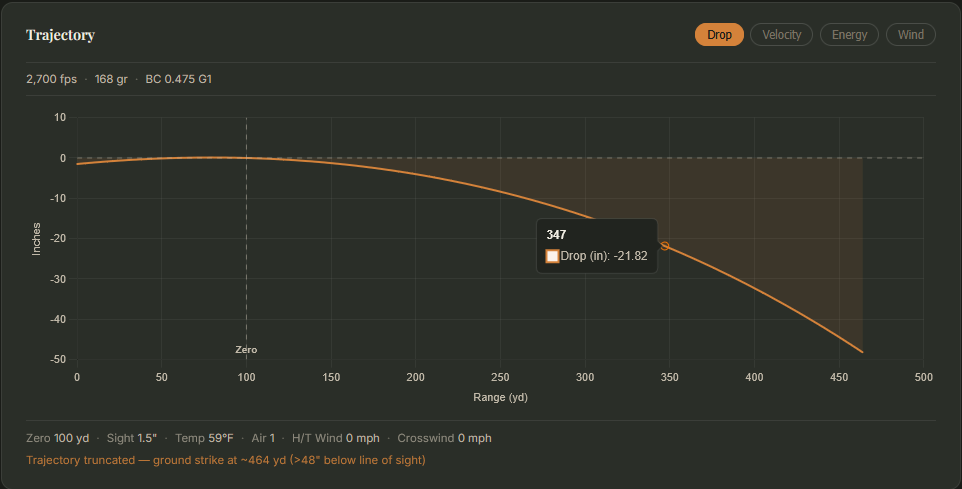
347 yards: -21.82 inches. Nearly two feet of holdover. You need to know this before the shot, not after.
The data row gives you fixed-distance snapshots. The bubble gives you the exact number at whatever distance you're actually shooting.
The Curve Steepens With Distance
Notice the shape of the curve in the graph. It doesn't drop at a constant rate. It steepens.
From 0 to 100 yards the curve is nearly flat. From 200 to 300 yards it falls much more steeply for the same distance traveled. That steepening is the physical reality of velocity decay: as the bullet slows down, gravity has more time to act over each successive hundred yards of flight.
The practical consequence is that distance estimation errors matter more at range. A 10-yard error at 150 yards costs you a fraction of an inch. A 10-yard error at 400 yards can cost you several inches, enough to matter on a real target. Because the BSL graph shows the continuous curve rather than snapshots at fixed increments, you can read the drop at 347 yards or 412 yards, not just 300 or 400. When you know your actual distance, the graph can give you the actual number.
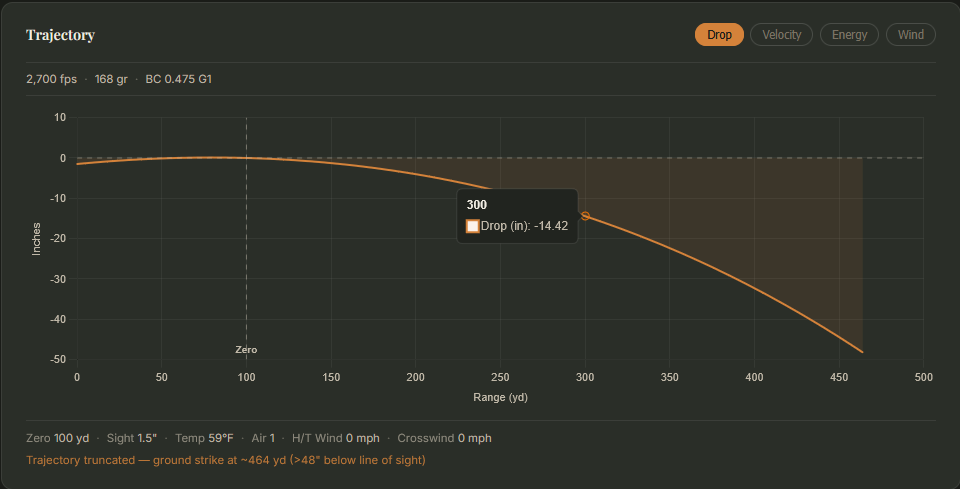
At 300 yards: -14.42 inches. Just over 14 inches is roughly the depth of a whitetail deer's vital zone.
Why Bullet Trajectory Matters covers the physics behind this in detail if you want the full explanation.
Wind: The Second Number
The BSL calculator also produces a wind drift graph. It reads the same way as the drop graph: horizontal axis is range, vertical axis is inches of displacement, and the zero line is your aim point. The difference is that displacement is now left or right instead of up or down.
A few things to know about how wind values work.
Tail wind and head wind affect bullet velocity slightly but contribute almost nothing to lateral drift. A tail wind (positive value in the calculator) pushes the bullet forward, giving gravity slightly less time to act. A head wind (negative value) slows the bullet, giving gravity slightly more time. For practical shooting the vertical effect of head and tail wind is small and usually rounded away. Where wind really matters is crosswind.
Crosswind is where drift really accumulates. The BSL calculator takes a crosswind value directly: a positive number is a right-to-left wind pushing the bullet to the right, and a negative number is a left-to-right wind pushing the bullet to the left. Both are full-value crosswinds. The drift compounds with range in the same way drop does: the bullet spends more time in the wind at distance than it does up close, so the curve steepens.
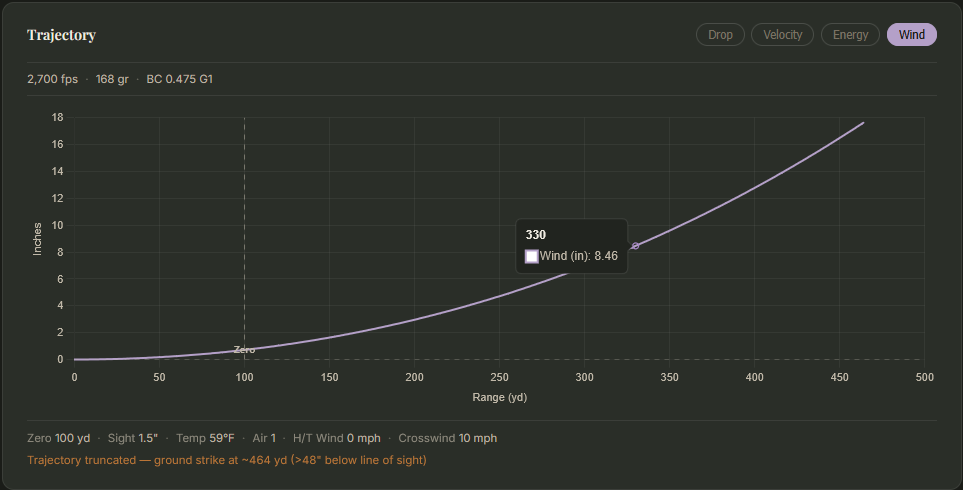
A 10 mph right crosswind at 330 yards: 8.46 inches of drift. Enter a negative value for a left crosswind and the curve mirrors to the other side.
Using the Graph in Practice
The data row above the graph is what you reference in the field. Before a hunt or a competition stage, run your load through the calculator with realistic conditions: your zero, your air density ratio, the expected temperature, and a reasonable wind estimate. Read the drop and drift values at the distances you expect to shoot. Write them down or commit them to memory.
The graph earns its value in the planning step. It shows you where the curve changes character, where your margin tightens, and where small errors in range estimation start to matter. A table of numbers at fixed increments doesn't show you that. The curve does.
If you haven't run your load yet, the BSL ballistics calculator is the place to start. Plug in your cartridge, set your zero, and watch the curve take shape. You'll know more about your load in five minutes than most shooters learn in years of guessing.
For a deeper look at choosing a zero that maximizes your practical range without holdover, watch for the upcoming article on maximum point-blank range.
For the physics behind why the curve steepens with distance, Why Bullet Trajectory Matters covers it from the ground up. And if you want to understand what drives one bullet's curve to be flatter than another's, What Is Ballistic Coefficient? is the right starting point.